15 States with the Worst Teen Drivers [+Texting & Drinking Rates]
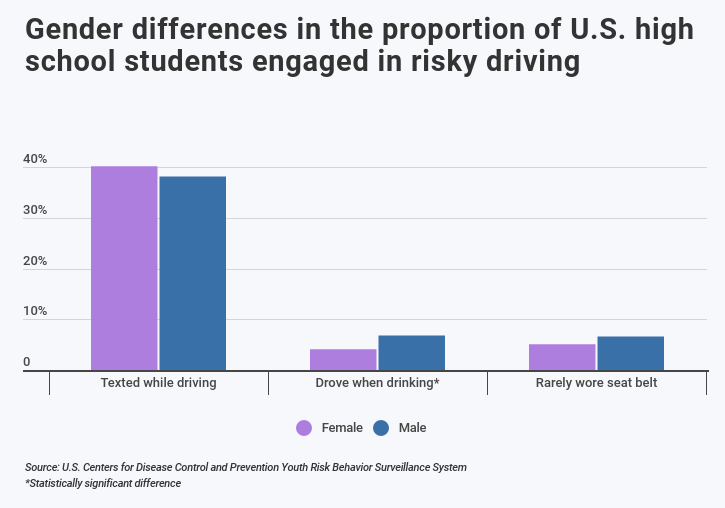
Our study found that male and female teenagers were equally likely to text and drive or fail to wear a seat belt. However, 6.8 percent of teenage male drivers are more likely to drink and drive than teenage female drivers. While the percentage of teenagers who have drunk and drove has gone down from 2015 to 2017, teenagers who text and drive have remained about the same. This contributes to the behaviors of the deadliest teen drivers.
Read moreFree Car Insurance Comparison
Compare Quotes From Top Companies and Save
Secured with SHA-256 Encryption
Adam H. Rosenblum
Principal Attorney
Adam Rosenblum is a founding attorney with over 20 years of experience. His firm, Rosenblum Law, has offices throughout New York and New Jersey. Mr. Rosenblum’s primary focus is on personal injury, criminal defense, and traffic violations. He is admitted to practice in all state and federal courts in New York and New Jersey and is a graduate of Albany Law School. Adam’s extensive experience...
Principal Attorney
UPDATED: Dec 12, 2023
It’s all about you. We want to help you make the right coverage choices.
Advertiser Disclosure: We strive to help you make confident car insurance decisions. Comparison shopping should be easy. We are not affiliated with any one car insurance provider and cannot guarantee quotes from any single provider.
Our car insurance industry partnerships don’t influence our content. Our opinions are our own. To compare quotes from many different car insurance companies please enter your ZIP code on this page to use the free quote tool. The more quotes you compare, the more chances to save.
Editorial Guidelines: We are a free online resource for anyone interested in learning more about car insurance. Our goal is to be an objective, third-party resource for everything car insurance-related. We update our site regularly, and all content is reviewed by car insurance experts.
UPDATED: Dec 12, 2023
It’s all about you. We want to help you make the right coverage choices.
Advertiser Disclosure: We strive to help you make confident car insurance decisions. Comparison shopping should be easy. We are not affiliated with any one car insurance provider and cannot guarantee quotes from any single provider.
Our car insurance industry partnerships don’t influence our content. Our opinions are our own. To compare quotes from many different car insurance companies please enter your ZIP code on this page to use the free quote tool. The more quotes you compare, the more chances to save.
On This Page
For many teenagers, getting their driver’s license is as exciting as it is stressful. Driving a car means freedom, but it also comes with a great deal of responsibility and risk. For some teenagers, it can be difficult to fully appreciate that risk. According to the Centers for Disease Control and Prevention (CDC), teenage drivers are more likely than older drivers to make critical errors that result in serious crashes. For example, they are more likely to speed and less likely to keep a safe distance between vehicles.
Motor vehicle crashes can be costly on numerous levels. The CDC reports that young people ages 15 to 19 make up slightly more than 6 percent of the population. Yet, in 2016, they were responsible for 8.4 percent ($13.6 billion) of total motor vehicle injury costs.
The National Highway Traffic Safety Administration (NHTSA) finds that 16- to 20-year-olds account for 8.3 percent of all traffic fatalities in the U.S.
Every parent wants to do their part to keep their teenage driver as safe as possible. To raise awareness of potentially risky behaviors, our researchers turned to the latest data on teen driving patterns from the CDC’s Youth Risk Behavior Surveillance System and NHTSA’s Fatality Analysis Reporting System. The researchers studied stats on seat belt use, drinking and driving, texting and driving, and fatalities. Here’s what they found:
Key Findings
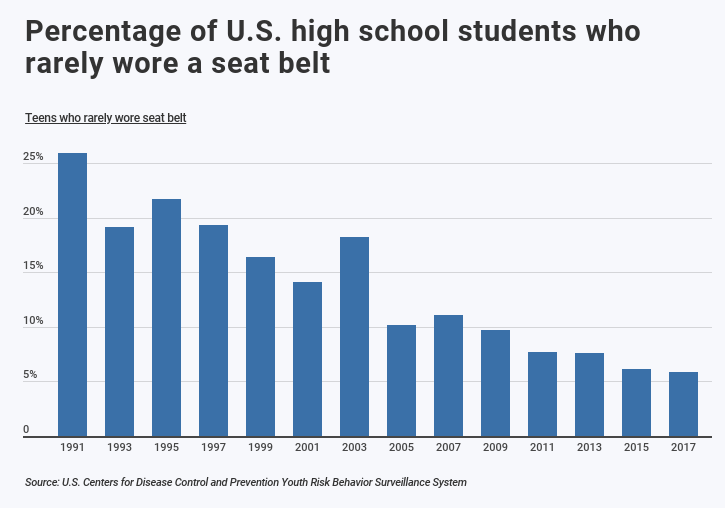
While the statistics surrounding teenage drivers can be grim, there is positive news. For example, more teens are taking preventive safety measures when they drive. In 1991, the CDC found that 25.9 percent of teens said they rarely wore their seat belt. However, that number has steadily decreased over the years. As of 2017, just 5.9 percent of teens said they rarely buckled up.
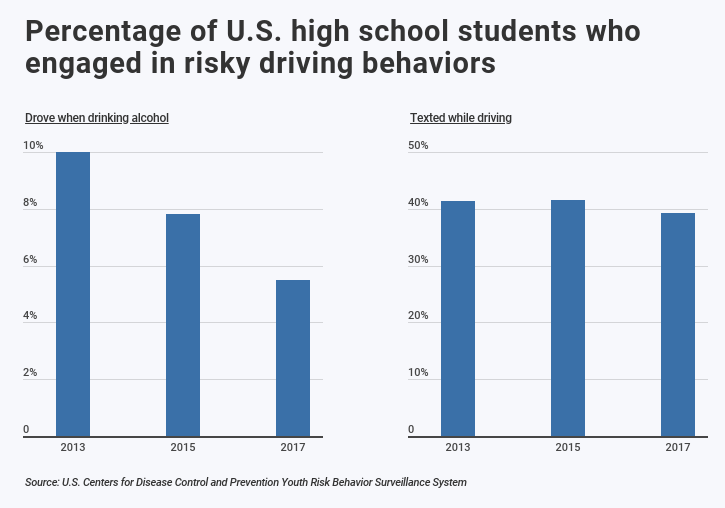
Similarly, drinking and driving among teens has improved over the years. From 2013 to 2017, the percentage of teens who said they drink and drive fell from 10 percent to 5.5 percent. Yet, it is important to note that teen drivers are more likely than older drivers to be involved in motor vehicle crashes when they do drink and drive.
Despite improvements in seat belt use and impaired driving, national data shows no significant change in the number of teens who said they text and drive. From 2013 to 2017, the percentage of teens who engaged in this behavior remained flat at approximately 40 percent.
Texting while driving is an especially dangerous type of distracted driving because it involves manual, visual, and cognitive distraction. In the course of sending or reading a text message, drivers will take their eyes off the road for an average of five seconds. Even that short amount of time translates to the distance of a football field when driving at 55 mph.
At the state level, teen texting and driving shows a statistically significant positive correlation with teen motor vehicle fatalities by population. In general, states with more teens who text and drive also have more teens who die in motor vehicle accidents.
Interestingly, neither drinking and driving nor seat belt use show significant correlations with the number of teen motor vehicle fatalities. While correlation does not imply causation, this data—in addition to everything else known about distracted driving—makes a strong case for actively reducing cell phone use among teen drivers.
RELATED:
Age is one of the most important factors in determining car insurance rates. For example, car insurance for a 19 year old driver is far above the national average. Luckily, there are drivers ed insurance discounts available for new drivers.
When comparing gender across these statistics, both male and female teens are equally as likely to text and drive and fail to wear a seat belt. However, teenage males are significantly more likely than teenage females to drink and drive. Of teenage males, 6.8 percent report drinking and driving compared to 4.1 percent of teenage females.
NHTSA data further shows that teenage males are nearly twice as likely as teenage females to be involved in fatal motor vehicle crashes. In 2017, the organization found that 1,807 teenage males died as a result of a crash, compared to 925 teenage females. Fortunately, teen motor vehicle fatalities are down nearly a third from 1975 and the most significant declines are among teenage males.
With these trends in mind, we wanted to use these statistics to identify the states with the most dangerous teenage drivers. To do this, our researchers created a composite score for each state based on the following metrics:
- Percentage of teens who text and drive
- Percentage of teens who drink and drive
- Percentage of teens who rarely wear a seat belt
- Teen traffic fatality rate per 100k teens
Only states with data available from the Youth Risk Behavior Surveillance System were included in the analysis. Here are the states with the most at-risk teenage drivers.
Enter your ZIP code below to view companies that have cheap auto insurance rates.
Secured with SHA-256 Encryption
15 States with the Most Dangerous Teenage Drivers
#15 – Arizona
- Teens who text & drive: Data not available
- Teens who drink & drive: 6.2% (12.7% worse than average)
- Teens who rarely wear a seat belt: 8.1% (37.3% worse than average)
- Teen traffic fatality rate: 12.6 per 100k (5.6% worse than average)
- Teen traffic fatalities: 59 per year
#14 – West Virginia
- Teens who text & drive: 34.0% (13.3% better than average)
- Teens who drink & drive: 5.4% (1.8% better than average)
- Teens who rarely wear a seat belt: 8.9% (50.8% worse than average)
- Teen traffic fatality rate: 22.2 per 100k (85.7% worse than average)
- Teen traffic fatalities: 24 per year
#13 – Texas
- Teens who text & drive: 39.3% (0.3% worse than average)
- Teens who drink & drive: 7.1% (29.1% worse than average)
- Teens who rarely wear a seat belt: 7.1% (20.3% worse than average)
- Teen traffic fatality rate: 13.6 per 100k (13.9% worse than average)
- Teen traffic fatalities: 273 per year
DID YOU KNOW?
Ever wonder how much it costs to insure a corvette? Even though the corvette is one of the fastest cars on the road, it’s also one of the most affordable cars to insure. In fact, car insurance for a corvette is similar in price to insurance on a Mini Cooper.
#12 – Kansas
- Teens who text & drive: 48.0% (22.4% worse than average)
- Teens who drink & drive: 6.4% (16.4% worse than average)
- Teens who rarely wear a seat belt: 5.0% (15.3% better than average)
- Teen traffic fatality rate: 17.5 per 100k (46.2% worse than average)
- Teen traffic fatalities: 35 per year
#11 – Oklahoma
- Teens who text & drive: 45.7% (16.6% worse than average)
- Teens who drink & drive: 5.3% (3.6% better than average)
- Teens who rarely wear a seat belt: 8.0% (35.6% worse than average)
- Teen traffic fatality rate: 19.7 per 100k (64.9% worse than average)
- Teen traffic fatalities: 52 per year
#10 – South Carolina
- Teens who text & drive: 45.4% (15.8% worse than average)
- Teens who drink & drive: 7.5% (36.4% worse than average)
- Teens who rarely wear a seat belt: 6.8% (15.3% worse than average)
- Teen traffic fatality rate: 14.3 per 100k (19.4% worse than average)
- Teen traffic fatalities: 46 per year
#9 – Idaho
- Teens who text & drive: 47.0% (19.9% worse than average)
- Teens who drink & drive: 6.0% (9.1% worse than average)
- Teens who rarely wear a seat belt: 7.3% (23.7% worse than average)
- Teen traffic fatality rate: 17.3 per 100k (44.5% worse than average)
- Teen traffic fatalities: 21 per year
#8 – Tennessee
- Teens who text & drive: 49.0% (25.0% worse than average)
- Teens who drink & drive: Data not available
- Teens who rarely wear a seat belt: 8.9% (50.8% worse than average)
- Teen traffic fatality rate: 14.4 per 100k (20.1% worse than average)
- Teen traffic fatalities: 61 per year
#7 – Iowa
- Teens who text & drive: 55.2% (40.8% worse than average)
- Teens who drink & drive: 6.5% (18.2% worse than average)
- Teens who rarely wear a seat belt: 6.8% (15.3% worse than average)
- Teen traffic fatality rate: 16.3 per 100k (36.3% worse than average)
- Teen traffic fatalities: 35 per year
TRENDING
Pay-as-you-go auto insurance is a fairly new type of insurance that’s gaining popularity as a savvy way for drivers to lower their insurance premiums. Essentially, this type of coverage offers usage-based rates that fluctuate by miles driven.
#6 – Missouri
- Teens who text & drive: 46.4% (18.4% worse than average)
- Teens who drink & drive: 5.3% (3.6% better than average)
- Teens who rarely wear a seat belt: 9.0% (52.5% worse than average)
- Teen traffic fatality rate: 22.6 per 100k (89.3% worse than average)
- Teen traffic fatalities: 89 per year
#5 – North Dakota
- Teens who text & drive: 52.6% (34.2% worse than average)
- Teens who drink & drive: 6.5% (18.2% worse than average)
- Teens who rarely wear a seat belt: 8.1% (37.3% worse than average)
- Teen traffic fatality rate: 19.0 per 100k (59.0% worse than average)
- Teen traffic fatalities: 9 per year
#4 – Nebraska
- Teens who text & drive: 48.3% (23.2% worse than average)
- Teens who drink & drive: 6.3% (14.5% worse than average)
- Teens who rarely wear a seat belt: 8.5% (44.1% worse than average)
- Teen traffic fatality rate: 20.7 per 100k (73.0% worse than average)
- Teen traffic fatalities: 27 per year
#3 – Louisiana
- Teens who text & drive: 43.0% (9.7% worse than average)
- Teens who drink & drive: 10.0% (81.8% worse than average)
- Teens who rarely wear a seat belt: 12.5% (111.9% worse than average)
- Teen traffic fatality rate: 17.7 per 100k (48.0% worse than average)
- Teen traffic fatalities: 53 per year
#2 – Arkansas
- Teens who text & drive: 46.2% (17.9% worse than average)
- Teens who drink & drive: 10.7% (94.5% worse than average)
- Teens who rarely wear a seat belt: 17.5% (196.6% worse than average)
- Teen traffic fatality rate: 14.6 per 100k (22.3% worse than average)
- Teen traffic fatalities: 29 per year
#1 – Montana
- Teens who text & drive: 54.2% (38.3% worse than average)
- Teens who drink & drive: 7.6% (38.2% worse than average)
- Teens who rarely wear a seat belt: 7.8% (32.2% worse than average)
- Teen traffic fatality rate: 20.5 per 100k (71.4% worse than average)
- Teen traffic fatalities: 13 per year
Methodology
To identify the states with the most dangerous teenage drivers, a composite score was calculated based on the following factors:
- Percentage of teens who text and drive
- Percentage of teens who drink and drive
- Percentage of teens who rarely wear a seat belt
- Teen traffic fatality rate per 100k teens
The following data sources were used:
- Statistics on risky teenage driving behavior are from the U.S. Centers for Disease Control and Prevention’s Youth Risk Behavior Surveillance System (YRBSS).
- Statistics on teenage traffic fatalities are from the National Highway Traffic Safety Administration’s Fatality Analysis Reporting System (FARS).
- Teenage population statistics are from the U.S. Census Bureau American Community Survey.
Only states with data from the YRBSS survey were included in the analysis. For a complete list of results for all states included in the analysis, see the charts with all the rankings below.
Full Study Results
| Rank | State | Texting and Driving | Drinking and Driving | Rarely Wearing Seat Belt | Teen Traffic Fatality Rate (per 100k) | Teen Traffic Fatalities |
|---|---|---|---|---|---|---|
| 1 | Montana | 54.2% | 7.6% | 7.8% | 20.5 | 13 |
| 2 | Arkansas | 46.2% | 10.7% | 17.5% | 14.6 | 29 |
| 3 | Louisiana | 43.0% | 10.0% | 12.5% | 17.7 | 53 |
| 4 | Nebraska | 48.3% | 6.3% | 8.5% | 20.7 | 27 |
| 5 | North Dakota | 52.6% | 6.5% | 8.1% | 19 | 9 |
| 6 | Missouri | 46.4% | 5.3% | 9.0% | 22.6 | 89 |
| 7 | Iowa | 55.2% | 6.5% | 6.8% | 16.3 | 35 |
| 8 | Tennessee | 49.0% | N/A | 8.9% | 14.4 | 61 |
| 9 | Idaho | 47.0% | 6.0% | 7.3% | 17.3 | 21 |
| 10 | South Carolina | 45.4% | 7.5% | 6.8% | 14.3 | 46 |
| 11 | Oklahoma | 45.7% | 5.3% | 8.0% | 19.7 | 52 |
| 12 | Kansas | 48.0% | 6.4% | 5.0% | 17.5 | 35 |
| 13 | Texas | 39.3% | 7.1% | 7.1% | 13.6 | 273 |
| 14 | West Virginia | 34.0% | 5.4% | 8.9% | 22.2 | 24 |
| 15 | Arizona | N/A | 6.2% | 8.1% | 12.6 | 59 |
| 16 | New Mexico | 39.6% | 6.5% | 7.5% | 12.2 | 17 |
| 17 | Florida | 35.1% | 5.8% | 8.0% | 15.5 | 186 |
| 18 | New Hampshire | 41.7% | 5.8% | 6.9% | 12.9 | 11 |
| 19 | Kentucky | 34.7% | 3.9% | 8.7% | 20.5 | 59 |
| 20 | Pennsylvania | 37.4% | 5.0% | 11.3% | 8.9 | 73 |
| 21 | Utah | 40.6% | 2.8% | 9.5% | 9.5 | 23 |
| 22 | North Carolina | 38.0% | 5.4% | 6.7% | 14.8 | 100 |
| 23 | Vermont | 34.1% | 7.3% | N/A | 7.2 | 3 |
| 24 | Wisconsin | 45.7% | 5.5% | 5.9% | 13.1 | 50 |
| 25 | Rhode Island | 37.3% | N/A | 6.7% | 11 | 8 |
| 26 | Maryland | 28.1% | 5.9% | N/A | 10.1 | 39 |
| 27 | Massachusetts | 35.6% | 5.7% | N/A | 6.2 | 28 |
| 28 | Illinois | 37.1% | 5.2% | N/A | 10 | 84 |
| 29 | Virginia | N/A | 5.6% | 6.4% | 7.8 | 42 |
| 30 | Maine | N/A | 4.3% | 6.1% | 15.1 | 12 |
| 31 | Colorado | 35.2% | 5.3% | 5.9% | 15.7 | 56 |
| 32 | Delaware | 45.0% | N/A | 5.5% | 6.6 | 4 |
| 33 | Connecticut | 33.0% | 6.3% | 6.4% | 5.3 | 13 |
| 34 | Michigan | 39.4% | 3.7% | 6.3% | 8.6 | 57 |
| 35 | Alaska | 28.6% | 4.3% | 7.6% | 4.3 | 2 |
| 36 | Nevada | 31.9% | 5.0% | 6.3% | 8.9 | 16 |
| 37 | California | 34.3% | 4.9% | 5.8% | 8 | 206 |
References:
- https://www.cdc.gov/motorvehiclesafety/teen_drivers/teendrivers_factsheet.html
- https://www-fars.nhtsa.dot.gov/People/PeopleAllVictims.aspx
- https://www.iihs.org/topics/fatality-statistics/detail/teenagers#trends
- https://www.nhtsa.gov/risky-driving/distracted-driving
- https://www.census.gov/
Frequently Asked Questions
What are the 15 States with the Worst Teen Drivers and their texting and drinking rates?
Here are the 15 states with the worst teen drivers based on data from the Insurance Institute for Highway Safety:
- Wyoming
- Montana
- Arkansas
- Alabama
- Oklahoma
- South Carolina
- Mississippi
- North Dakota
- Kentucky
- Louisiana
- Tennessee
- Missouri
- West Virginia
- New Mexico
- Kansas
What criteria were used to determine the worst teen drivers?
CarInsurance.org used five criteria to determine the states with the worst teen drivers. These criteria included:
- the number of teen driver fatalities per 100,000 population
- the percentage of teen drivers involved in fatal crashes
- the number of teens arrested for driving under the influence (DUI)
- the number of teens who admitted to texting while driving
- the number of teens who reported drinking and driving.
What were the texting rates for teens in these 15 states?
According to the same report, the texting rates for teens in these 15 states ranged from 36.1% (in North Carolina) to 50.4% (in Mississippi). Overall, the average texting rate for teens across these 15 states was 43.5%.
What were the drinking rates for teens in these 15 states?
The drinking rates for teens in these 15 states ranged from 5.3% (in Arizona) to 11.3% (in Missouri). The average drinking rate for teens across these 15 states was 8.6%.
How can parents help prevent their teens from becoming bad drivers?
There are several steps that parents can take to help prevent their teens from becoming bad drivers. These include:
- setting a good example by following traffic laws and avoiding distractions while driving
- enrolling their teens in a driver’s education course
- establishing clear rules and consequences for driving behavior
- regularly monitoring their teens’ driving habits
What steps can teens take to become better drivers?
Teens can become better drivers by practicing safe driving habits, such as:
- wearing seatbelts
- obeying traffic laws
- avoiding distractions while driving
- not driving under the influence of drugs or alcohol
They can also consider enrolling in a driver’s education course or participating in a safe driving program.
Enter your ZIP code below to view companies that have cheap auto insurance rates.
Secured with SHA-256 Encryption
Adam H. Rosenblum
Principal Attorney
Adam Rosenblum is a founding attorney with over 20 years of experience. His firm, Rosenblum Law, has offices throughout New York and New Jersey. Mr. Rosenblum’s primary focus is on personal injury, criminal defense, and traffic violations. He is admitted to practice in all state and federal courts in New York and New Jersey and is a graduate of Albany Law School. Adam’s extensive experience...
Principal Attorney
Editorial Guidelines: We are a free online resource for anyone interested in learning more about car insurance. Our goal is to be an objective, third-party resource for everything car insurance-related. We update our site regularly, and all content is reviewed by car insurance experts.


